— views
Variance measures how far data set is spread out from their average value.
require(tidyverse)

x <- c(1, 2, 3, 4, 5, 9, 50)
var(x)
(x - mean(x)) ^ 2 %>% sum() / (length(x) - 1)
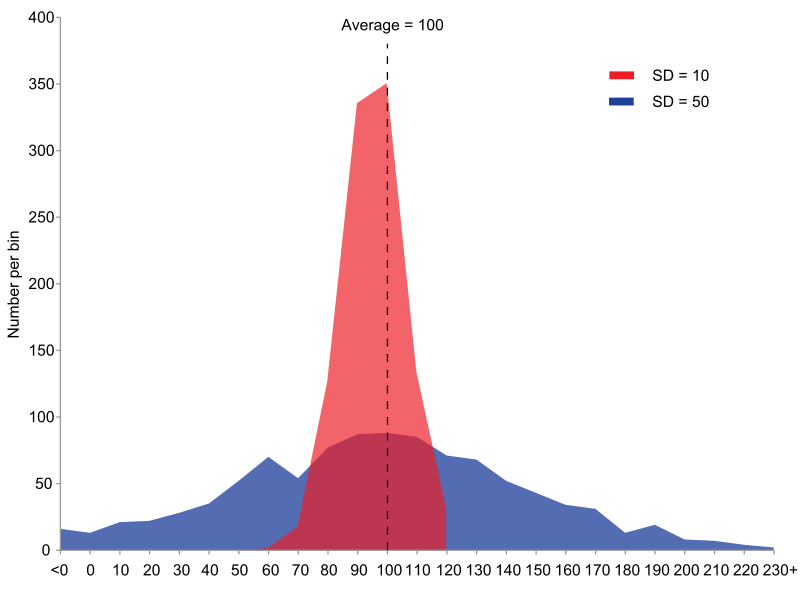
The example shows samples from two populations with the same mean but different variances. The red population has mean 100 and variance 100 (SD=10) while the blue population has mean 100 and variance 2500 (SD=50).